
Release Date :
Reference Number :
2025-034
INFLATION RATES FOR ALL ITEMS
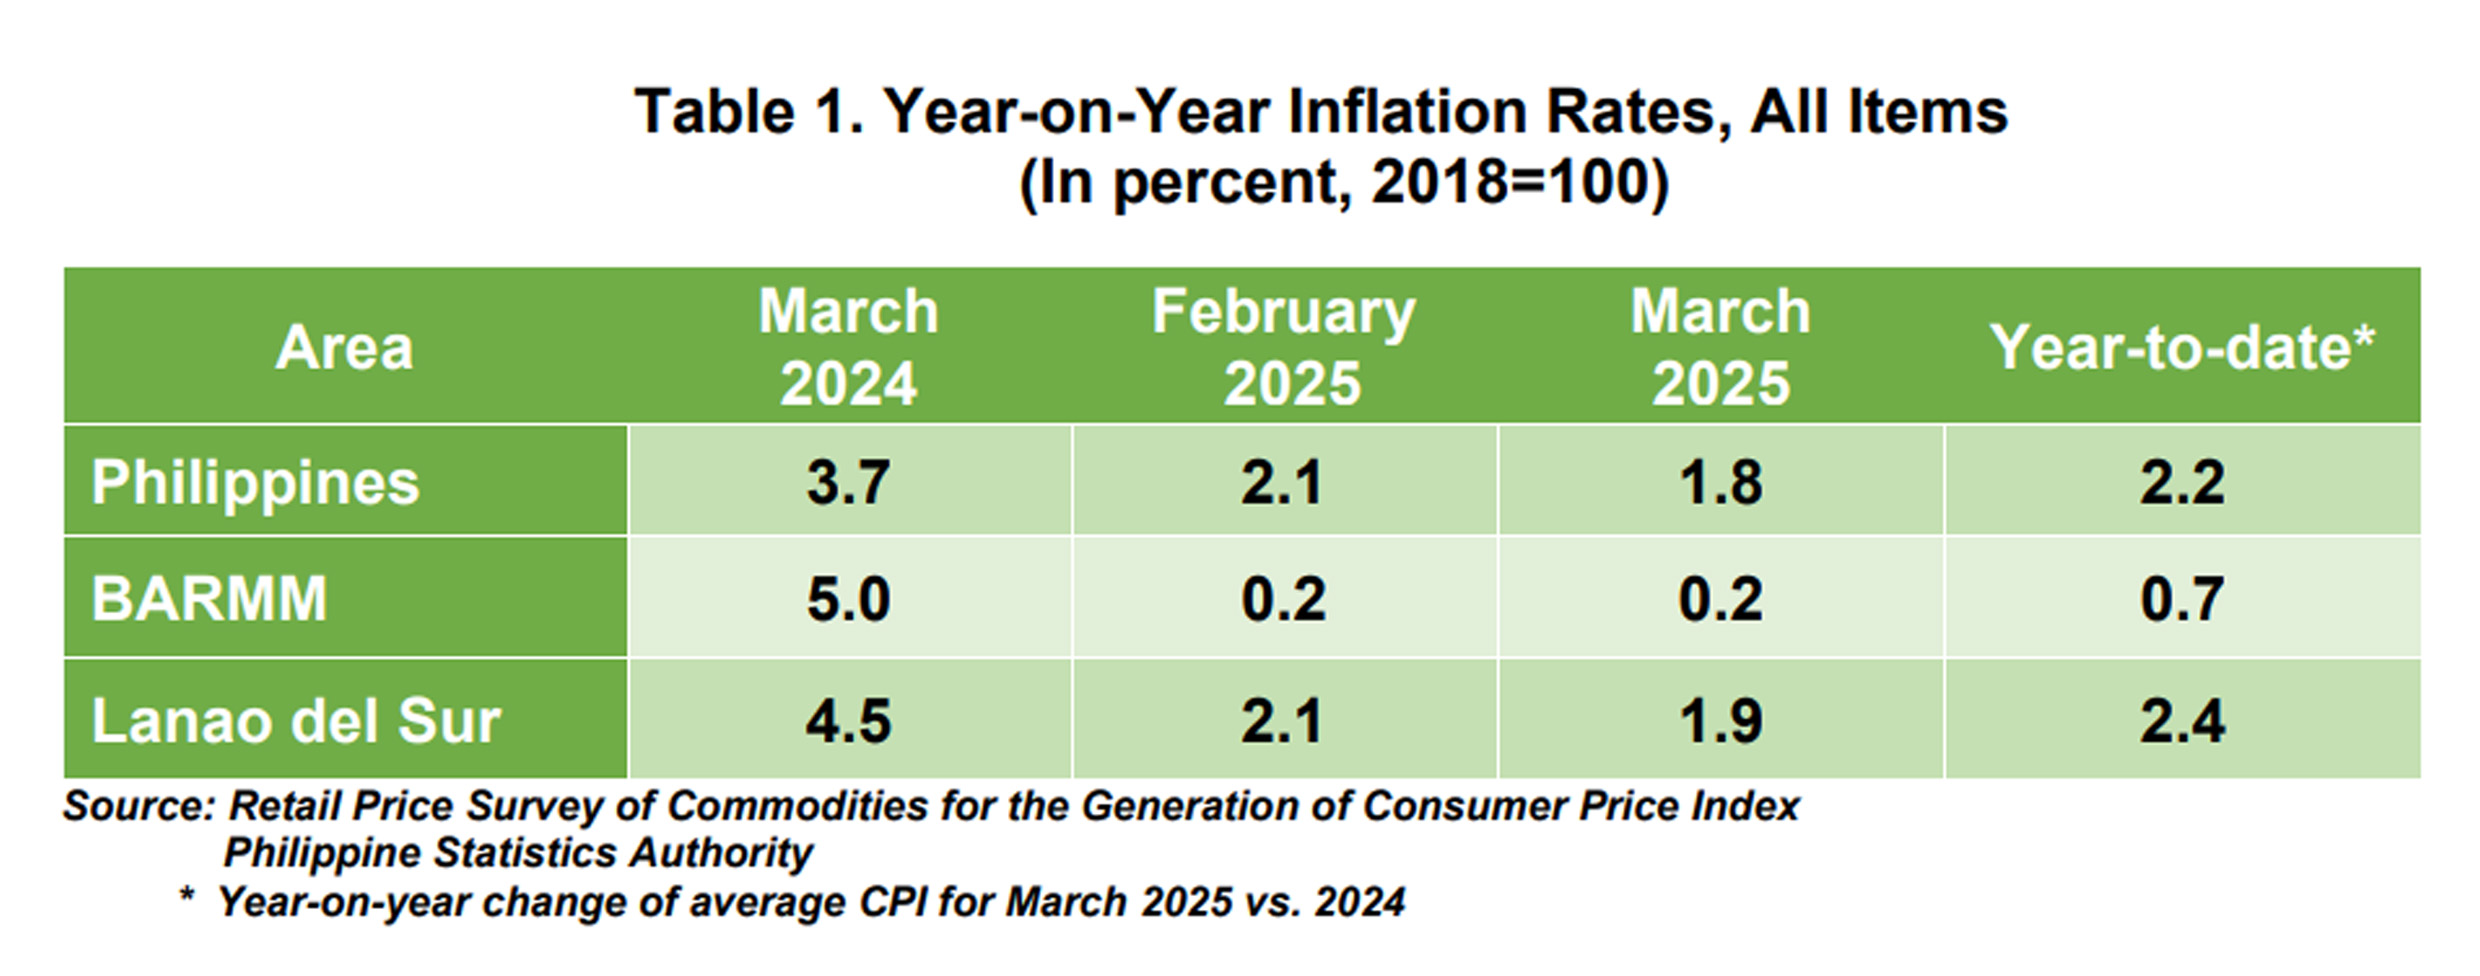
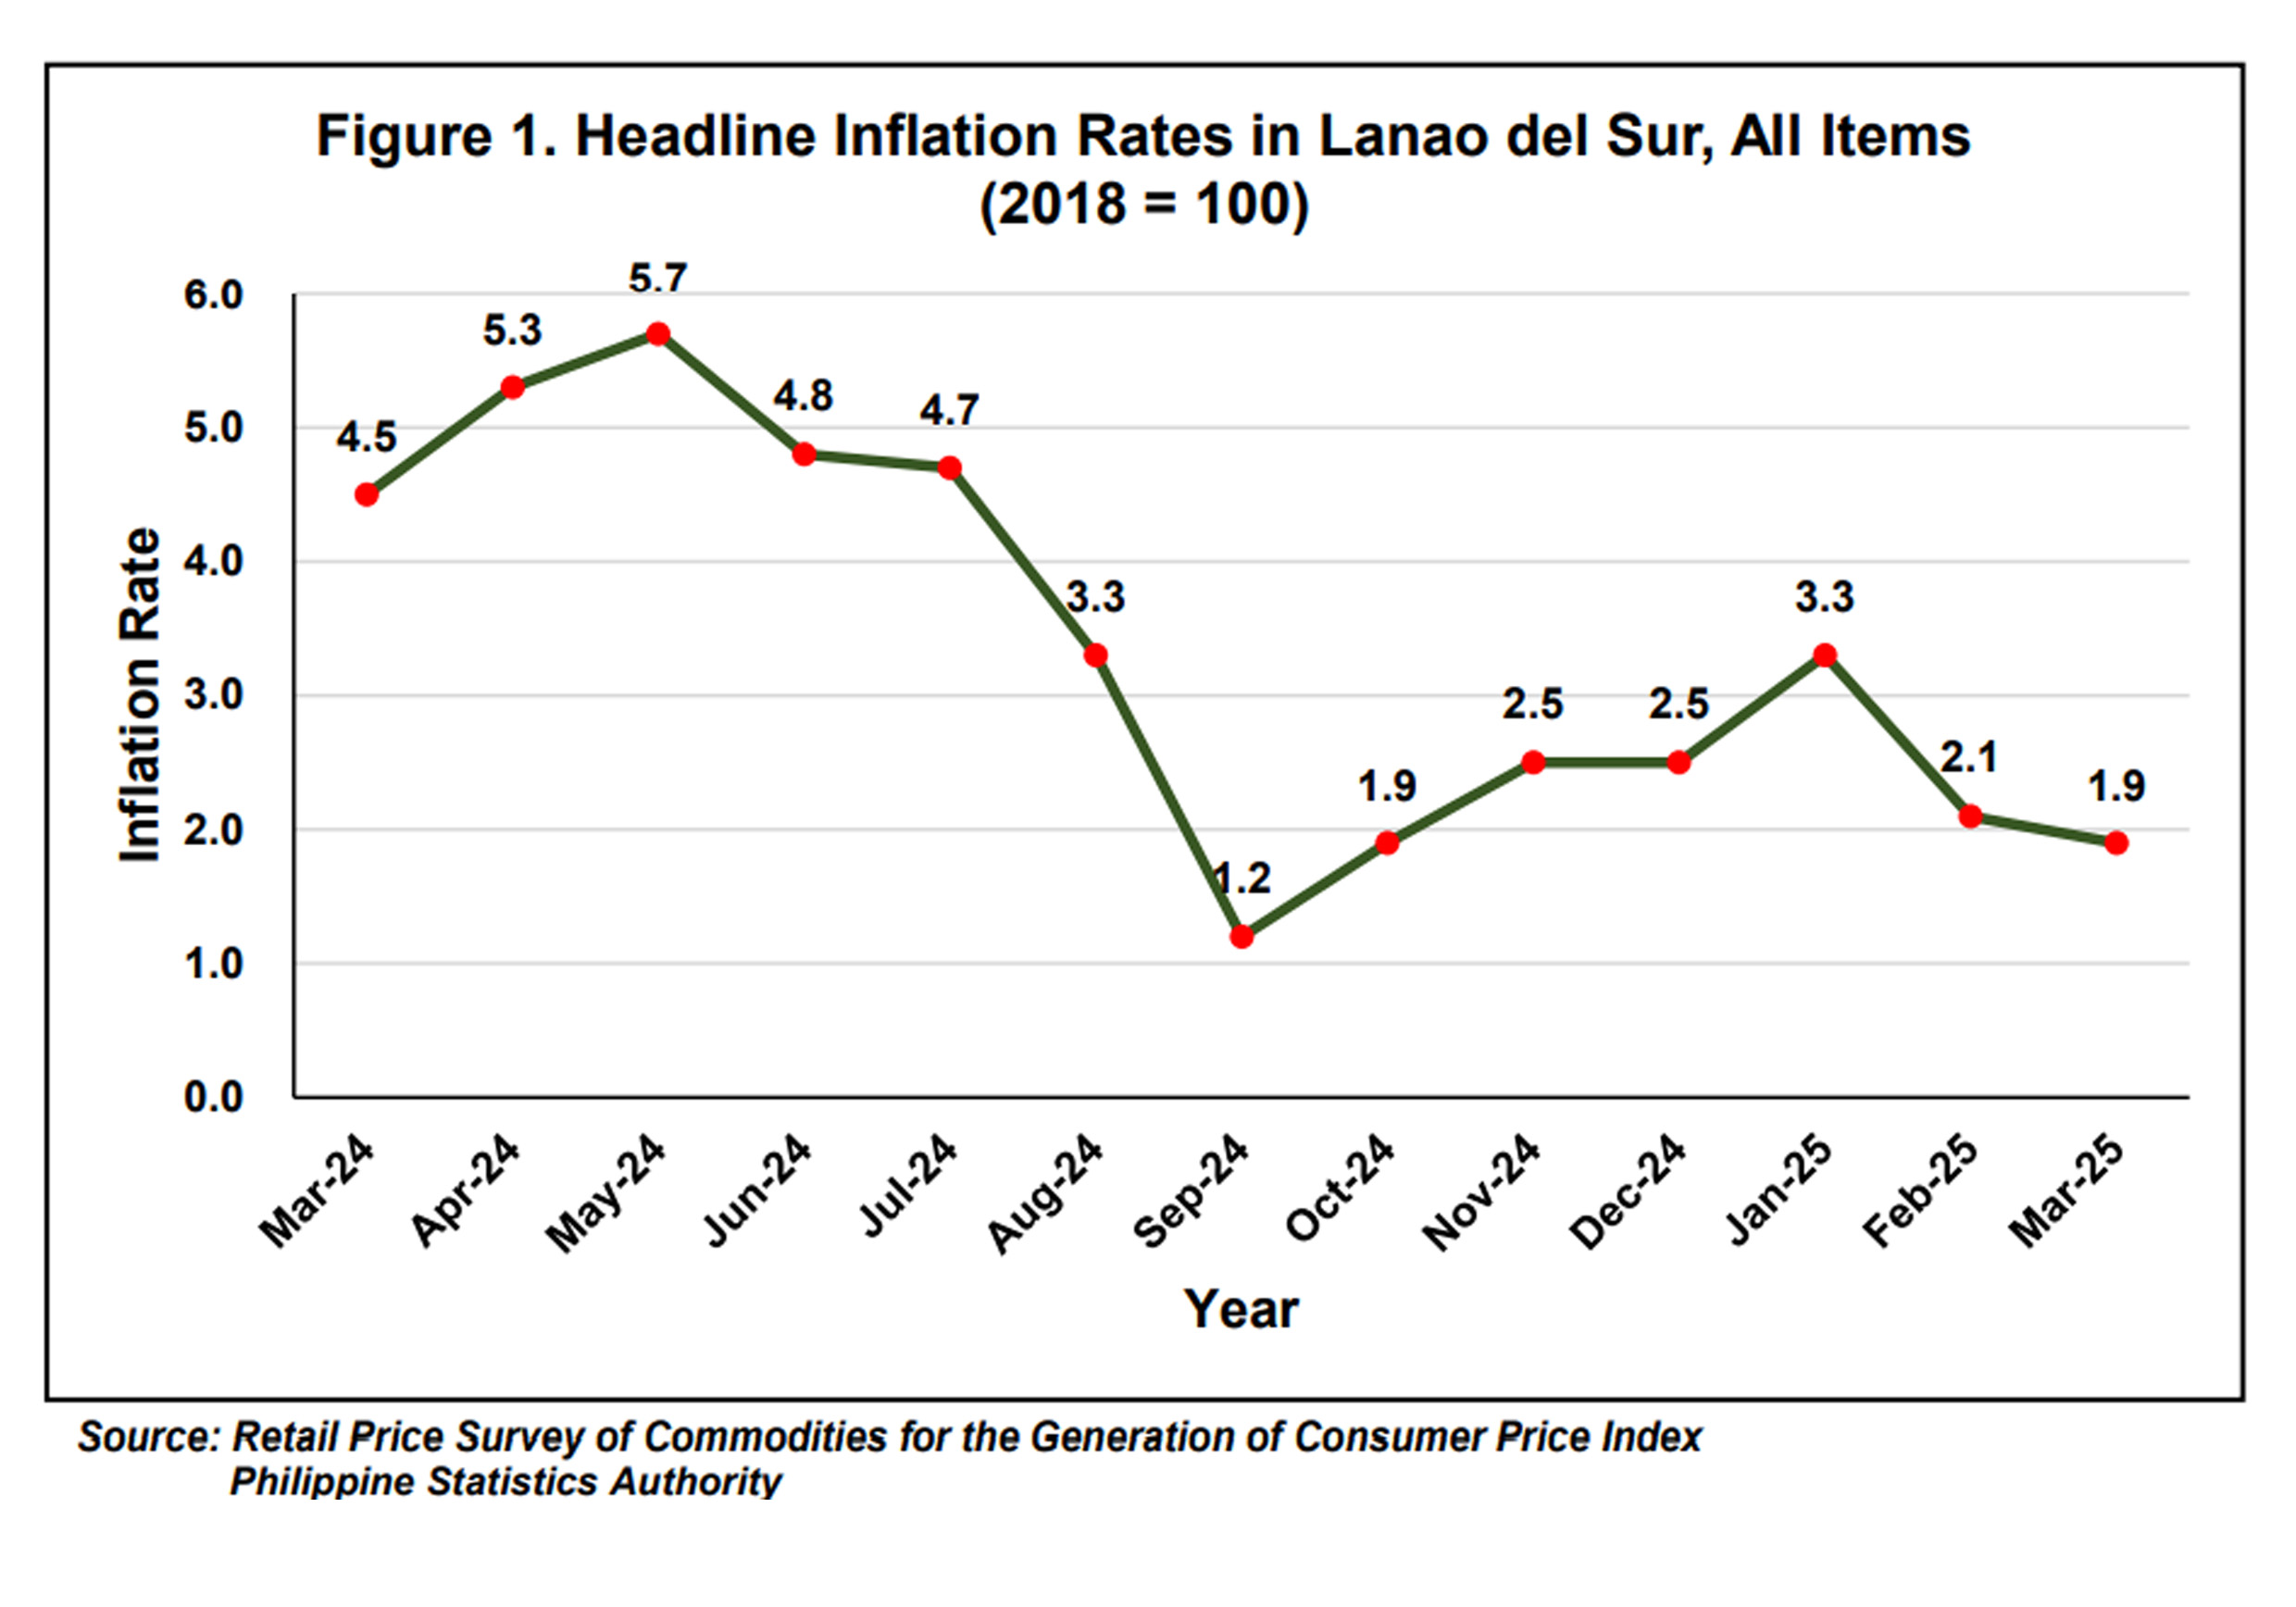
The headline inflation rate in Lanao del Sur province decreased further to 1.9 percent in March 2025 from 2.1 percent in February 2025 (see Figure 1).
This represents 2.6 percentage points lower from its level 4.5% in the same month last year. This is the lowest inflation since January 2025. Moreover, Lanao del Sur posted a 2.4 percent year-to-date inflation rate in All items. (see Table 1)
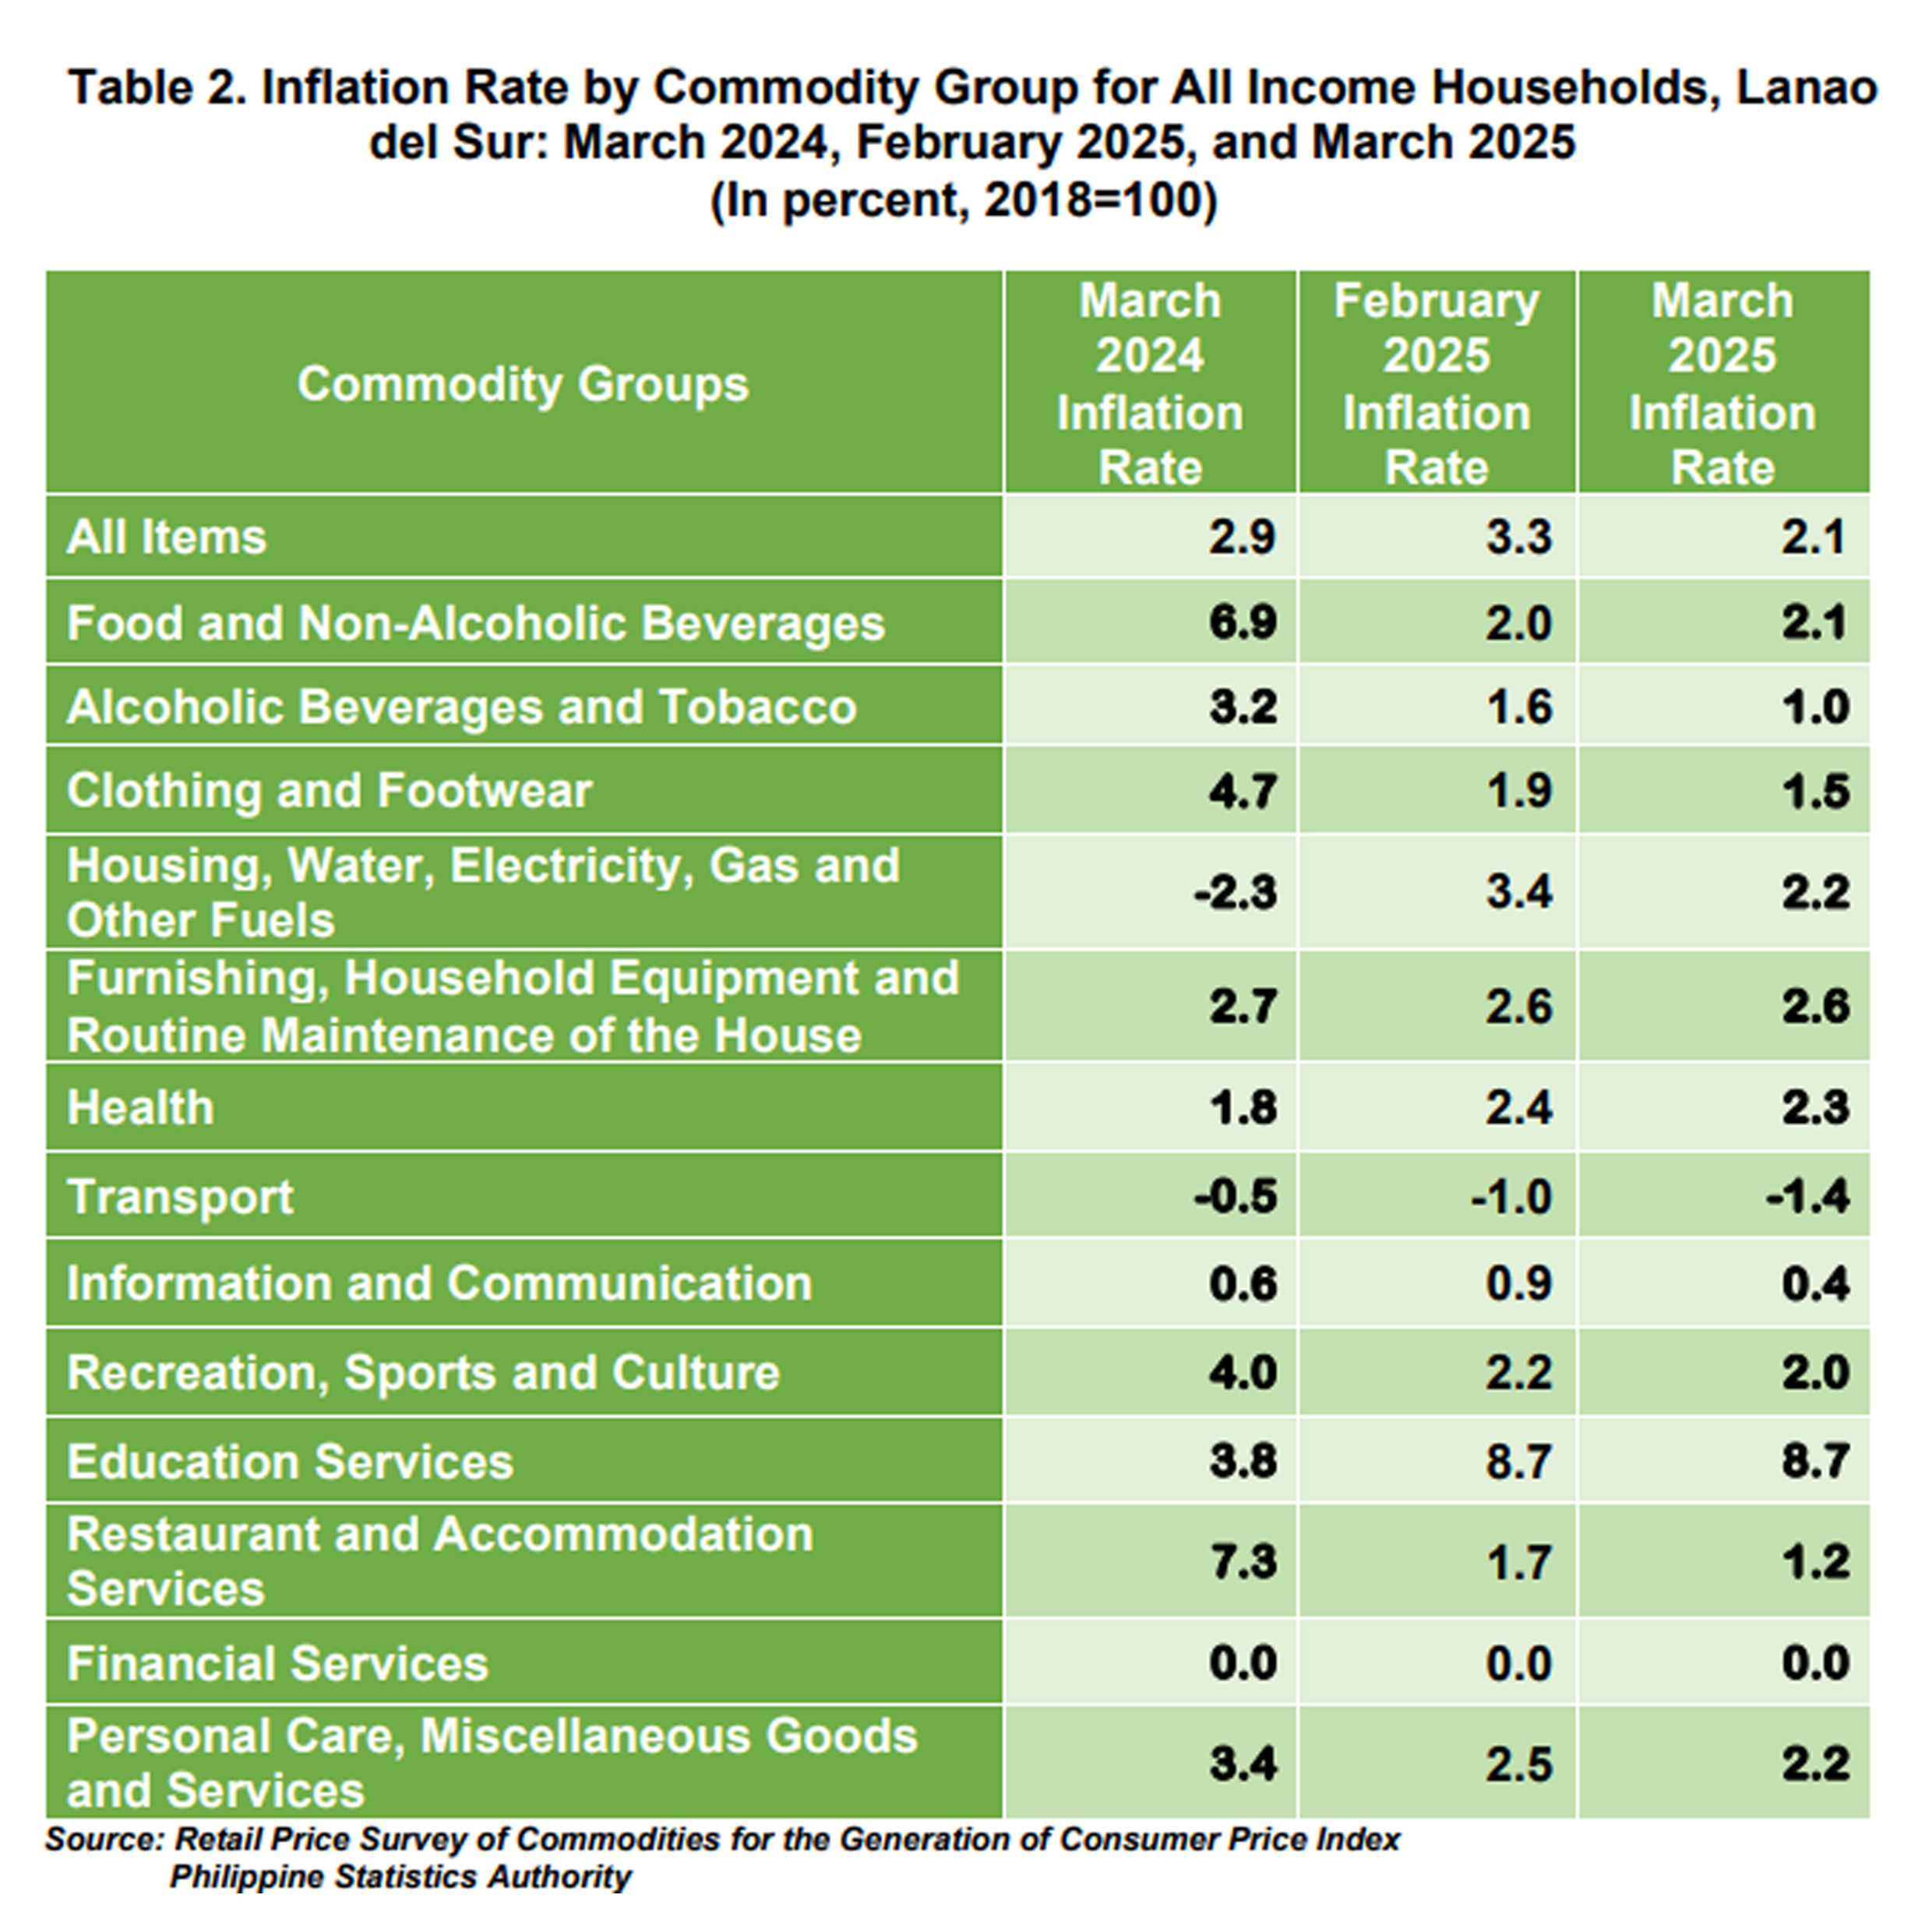
The decrease in price in the following Commodity Groups in province’s inflation
was mainly brought about by the slower annual decreases in the index for Housing, Water, Electricity, Gas and Other Fuels at 2.2 percent, Restaurants and Accommodation Services at 1.2 percent and Transport at negative 1.4 percent.Also contributing to the downtrend in the overall inflation during the period were the slow down annual depletion in the indices of the following commodity groups as compared with their previous month’s inflation rates:
a. Personal care, and miscellaneous goods and services at 2.2 percent;
b. Clothing and footwear at 1.5 percent;
c. Alcoholic beverages and tobacco at 1.0 percent;
d. Information and Communication at 0.4 percent;
e. Health at 2.3 percent;
f. Recreation, sport and culture at 2.0 percent;
Meanwhile, only commodity group of Food and Non-Alcoholic Beverages at 2.1 percent, shows higher inflation in March 2025.
On the other hand, the commodity group of Furnishing, Household Equipment and Routine Maintenance of the House, Financial and Education services are retained their previous month’s inflation rate. (See table 2)
INFLATION RATES FOR FOOD ITEMS
For food index, remained its previous month’s inflation at 2.1 percent in March 2025. However, in March 2024, food index was higher at 7.0 percent.
The decrease in the province’s food inflation rate was mainly brought about by the slower annual decreases in the index for Cereals and cereal products at negative 0.2 percent, Rice at negative 0.8 percent and Milk, Other Dairy Products, and Eggs at 8.7 percent. Also contributing to the downtrend in the overall food inflation during the period were the lower annual depletion in the indices of the following food commodity groups as compared with their previous month’s inflation
rates:
a. Vegetables, tubers, plantains, cooking bananas and pulses at 2.7
percent; and
b. Ready-Made Food and Other Food Products N.E.C at 2.6 percent.
Meanwhile, the annual uptick higher indices on the commodity group are the
following:
a. Flour, Bread and Other Bakery Products, Pasta Products, and Other
Cereals at 2.5 percent;
b. Meat and other parts of slaughtered land animal at 10.6 percent;
c. Fish and other seafood at 4.4 percent;
d. Oils and Fats at 3.8 percent;
e. Fruits and nuts at negative 6.2 percent; and
f. Sugar, Confectionery and Desserts at negative 4.7 percent

PURCHASING POWER OF PESO
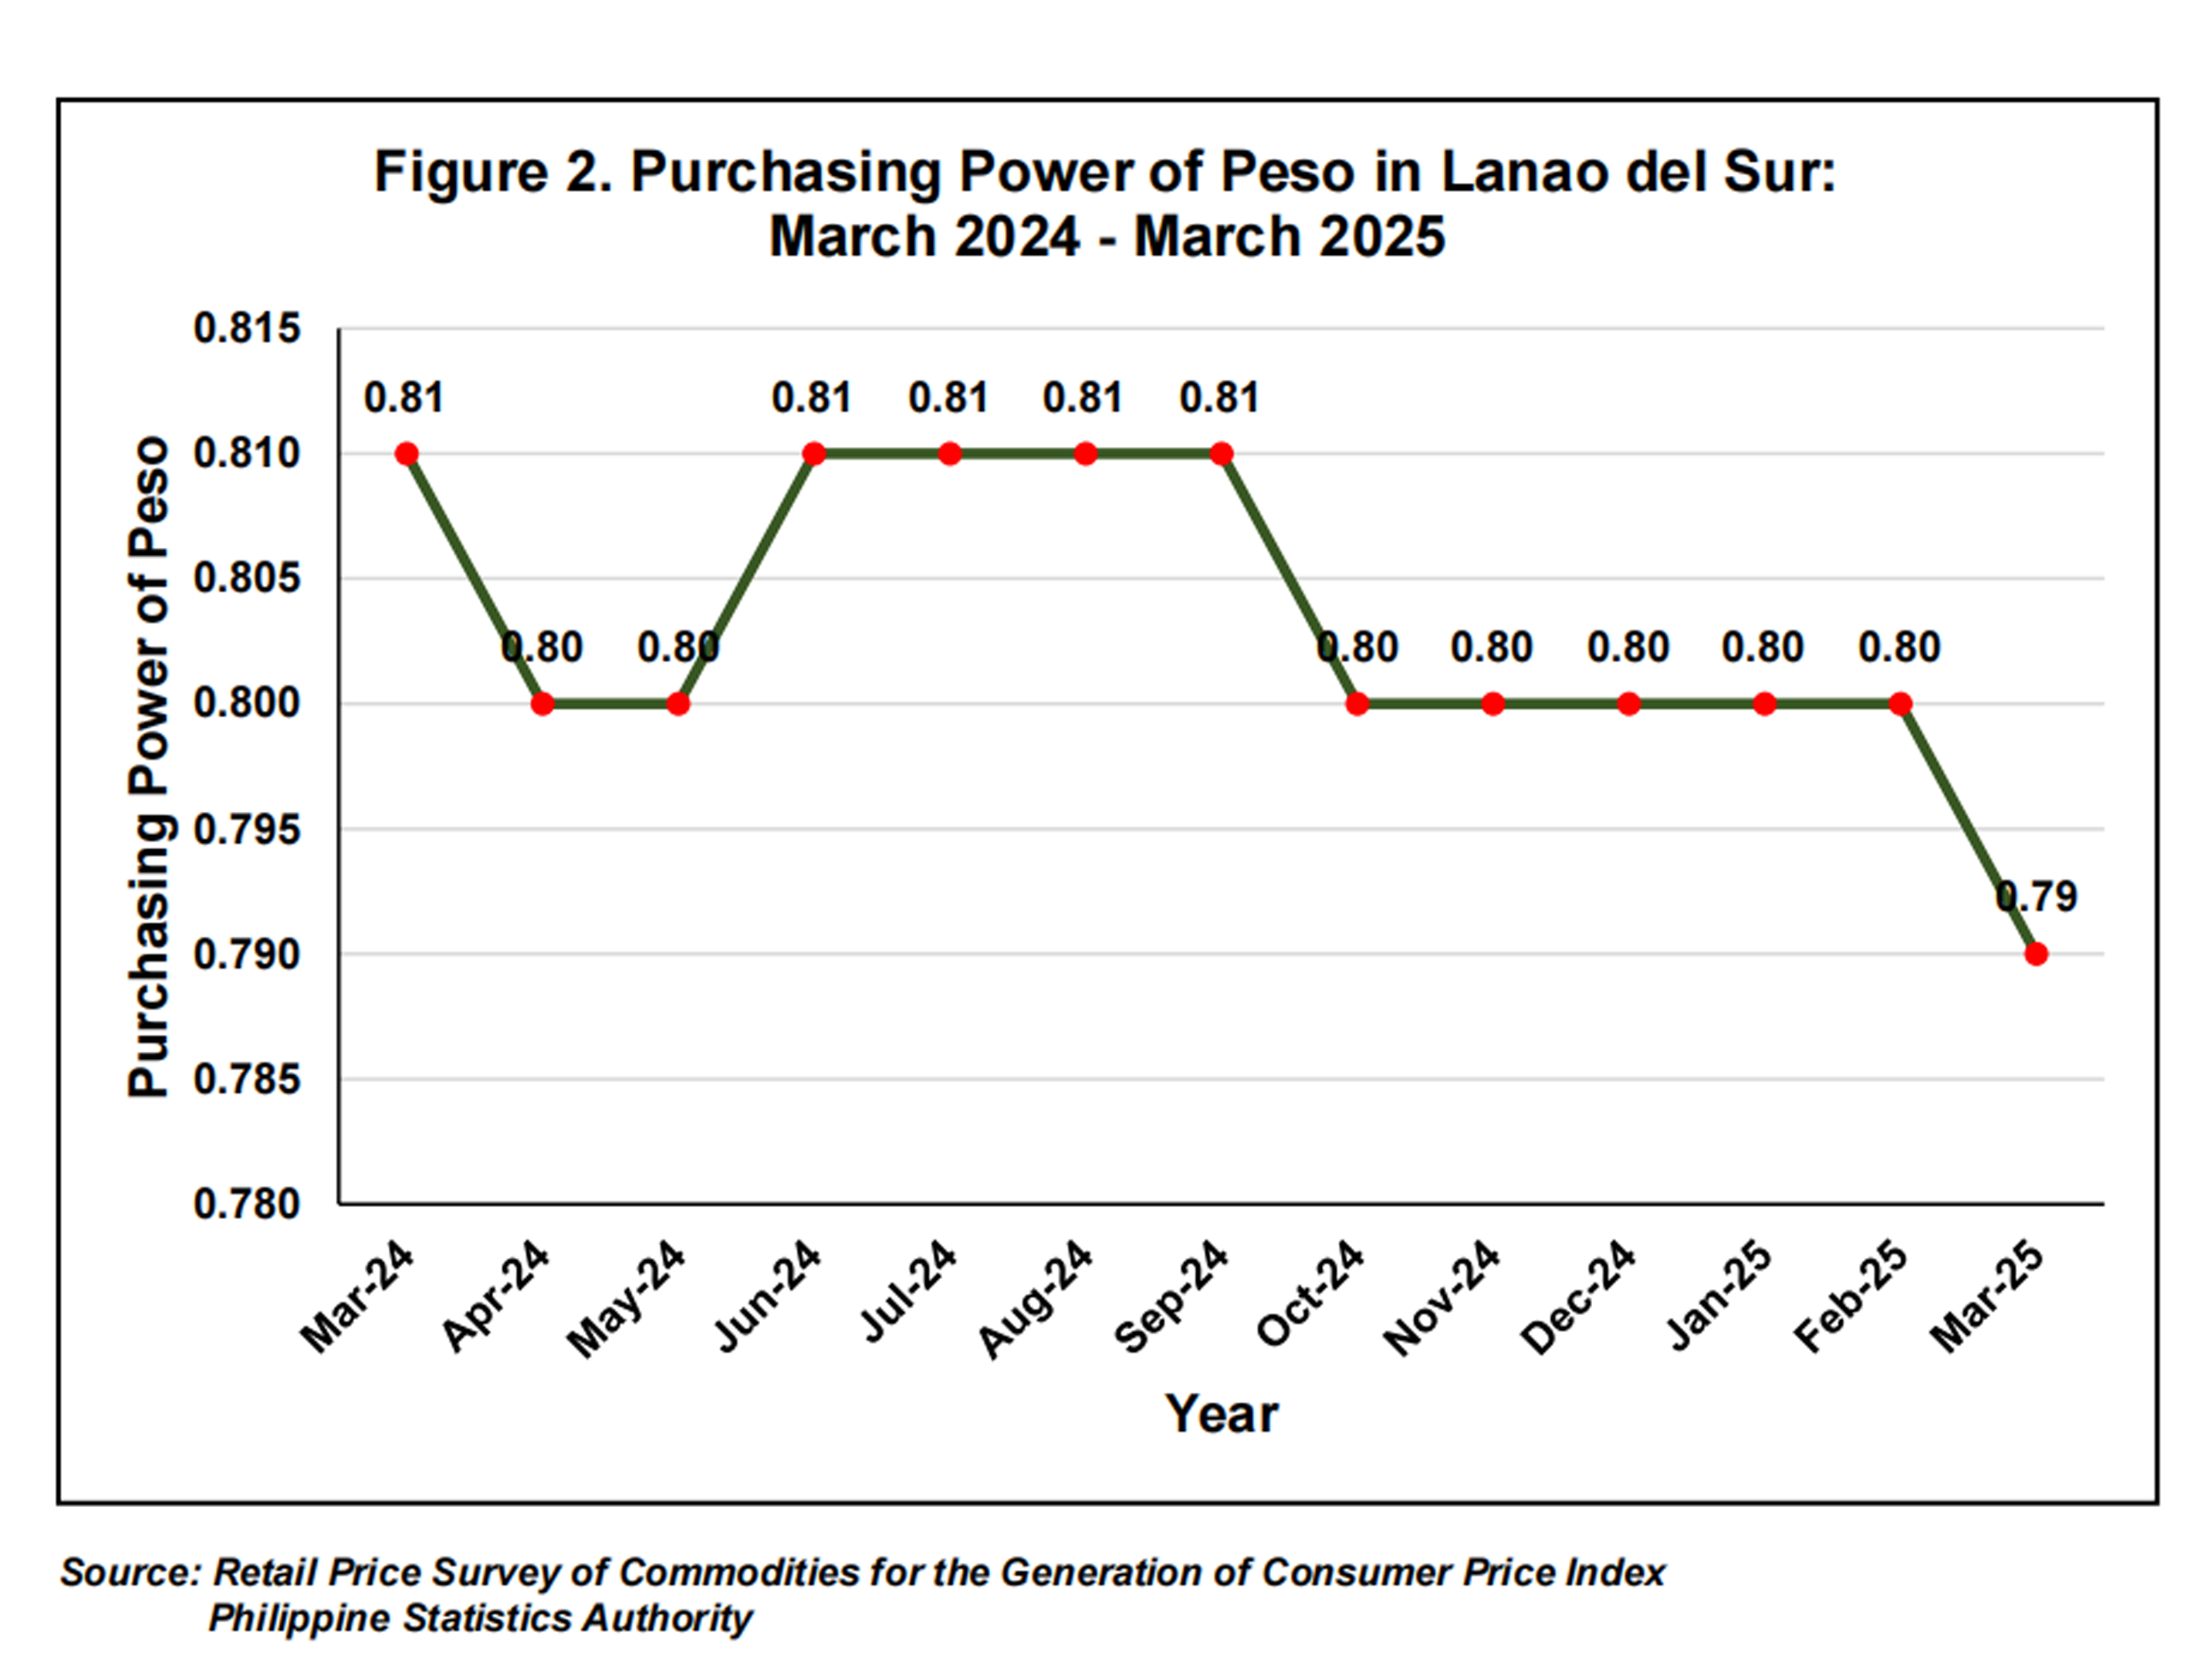
Purchasing Power of Peso (PPP) is inversely related to inflation rate. Thus, as the inflation rate increases, PPP declines. As shown in Figure 2, Lanao del Sur, PPP is declined compared to previous month at 0.79 as of March 2025. This is the lowest purchasing power of peso record since March 2024
TECHNICAL NOTES:
Consumer Price Index (CPI)
The CPI is an indicator of the changes in the average retail prices of a fixed basket of goods and services commonly purchased by households relative to a base year.
Uses of CPI
The CPI is most widely used in the calculation of the inflation rate and purchasing power of peso. It is a major statistical series used for economic analysis and as a monitoring indicator of government economic policy.
Computation of CPI
The computation of the CPI involves consideration of the following important points:
a. Base Period
The reference date or base period is the benchmark or reference date or period at which the index is taken as equal to 100.
b. Market Basket
A sample of the thousands of varieties of goods purchased for consumption and services availed by the households in the country selected to represent the composite price behavior of all goods and services purchased by consumers.
c. Weighting System
The weighting pattern uses the expenditures on various consumer items purchased by households as a proportion to total expenditure.
d. Formula
The formula used in computing the CPI is the weighted arithmetic mean of price relatives, the Laspeyre’s formula with a fixed base year period (2006) weight.
e. Geographic Coverage
CPI values are computed at the national, regional, and provincial levels, and for selected cities.
Inflation Rate
the rate of change of the CPI expressed in percent. Inflation is interpreted in terms of declining purchasing power of peso.
Headline Inflation
refers to the rate of change in the CPI, a measure of the average standard “basket” of goods and services consumed by a typical family.
Purchasing Power of Peso
shows how much the peso in the base period is worth in the current period. It is computed as the reciprocal of the CPI for the period under review multiplied by 100.
Note: The dataset used in the special release is exclusive for BARMM region and Lanao del Sur province.
MOHAMMADALI R. ALONTO, MPA
OIC Chief Statistical Specialist
| Attachment | Size |
|---|---|
|
|
206.41 KB |