
A. INFLATION RATES FOR ALL ITEMS
Headline Inflation
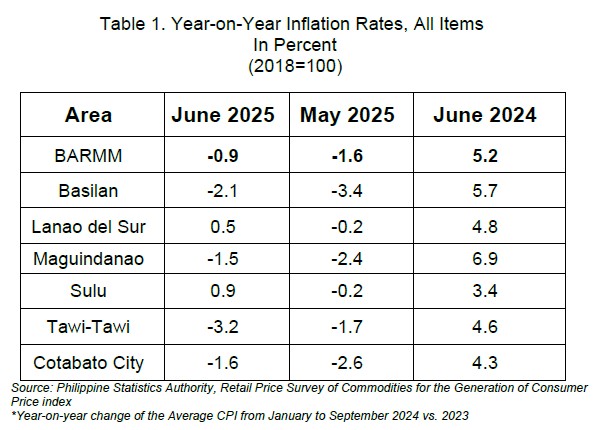
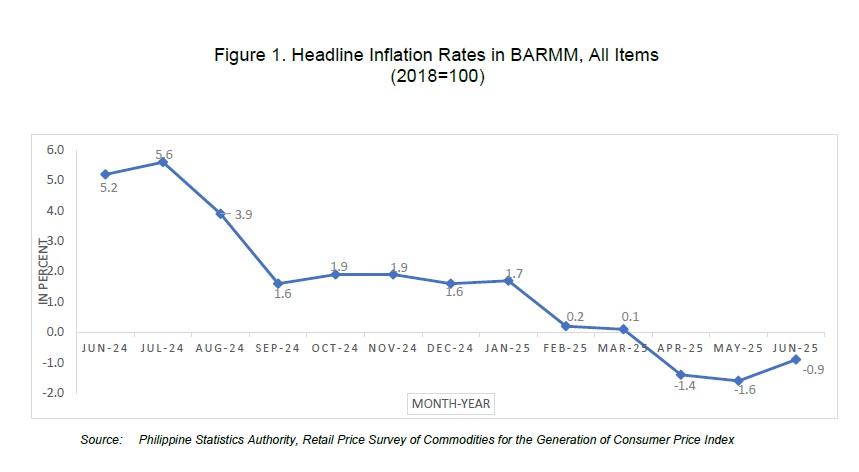
The Bangsamoro Autonomous Region in Muslim Mindanao (BARMM) recorded a headline inflation rate of -0.9 percent in June 2025, up from -1.6 percent in May 2025. In contrast, the inflation rate in June 2024 was significantly higher at 5.2 percent.
Meanwhile, Tawi-Tawi posted a faster deflation at -3.2 percent, compared to -1.7 percent in the previous month. On the other hand, Basilan, Lanao del Sur, Sulu, Maguindanao, and Cotabato City—an Independent Component City (ICC)—recorded higher inflation rates compared to their respective May 2025 levels. (See Table 1 and Figure 2.)
Main Drivers to the Downward Trend of the Headline Inflation
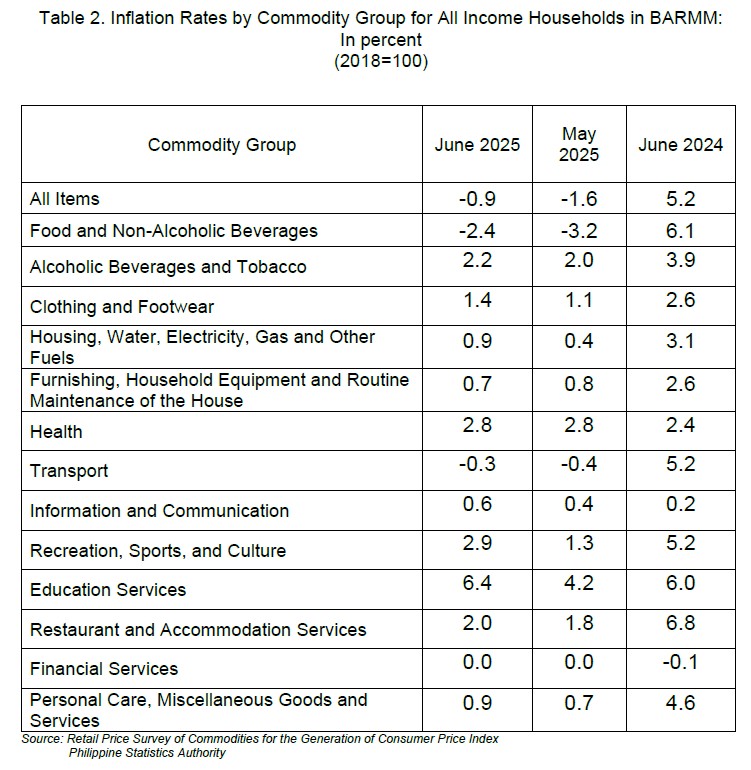
The increase in the overall inflation rate in BARMM in June 2025 was mainly attributed to the smaller annual decline in the index for Food and Non-Alcoholic Beverages, which posted -2.4 percent from -3.2 percent in the previous month.
Other major contributors were Housing, Water, Electricity, Gas, and Other Fuels, which rose to 0.9 percent from 0.4 percent, and Education Services, which accelerated to 6.4 percent in June 2025 from 4.2 percent in May 2025.
Additionally, the following commodity groups also recorded an increase in their inflation rates compared to the previous month:
a. Alcoholic beverages and tobacco, 2.2 percent from 2.0 percent;
b. Clothing and footwear, 1.4 percent from 1.1 percent;
c. Transport, -0.3 percent from -0.4 percent;
d. Information and communication, 0.6 percent from 0.4 percent;
e. Recreation, Sport and Culture, 2.9 percent from 1.3 percent;
f. Restaurants and accommodation services, 2.0 percent from 1.8 percent; and
g. Personal Care, and Miscellaneous Goods and Services, 0.9 percent from 0.7 percent.
Meanwhile, the commodity group that recorded a lower inflation rate in June 2025 was Furnishings, Household Equipment, and Routine Household Maintenance, which slowed to 0.7 percent from 0.8 percent in the previous month.
On the other hand, the inflation rates for Health and Financial Services remained unchanged from their May 2025 levels. (See Table 2.)
B. INFLATION RATES FOR FOOD ITEMS
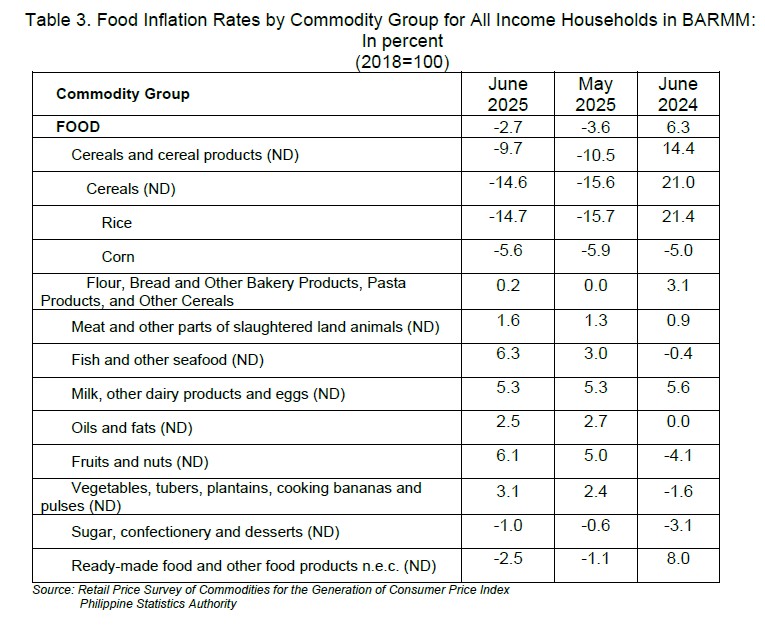
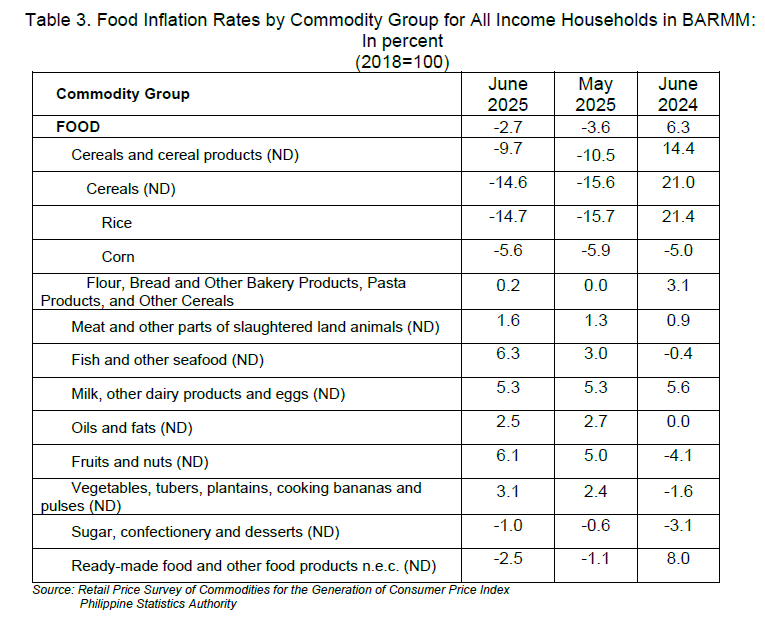
For food commodities, inflation upsurge to negative 2.7 percent in June 2025 from negative 3.6 percent in the previous month. In June 2025, inflation of food items was significantly higher at 6.3 percent. (Table 3)
The increase in the region’s food inflation was primarily driven by the higher indices for Fish and other seafood (ND) at 6.3 percent from 3.0 percent in the previous month; Cereals and cereals products (ND) at negative 9.7 percent from negative 10.5 percent.
Cereals (ND), at negative 14.7 percent from negative 15.7 percent; and negative 14.7 percent from negative 15.6 percent, respectively.
Also contributing to the increase in overall inflation during the period were the higher annual rates recorded in the following food commodity groups compared to their May 2025 levels:
a. Vegetables, tubers, plantains, cooking bananas, and pulses (ND) – 3.1 percent
b. Fruits and nuts (ND) – 3.1 percent
c. Meat and other parts of slaughtered land animals (ND) – 1.6 percent
On the other hand, the following food groups posted lower inflation rates in June 2025:
d. Oils and fats – 2.5 percent, down from 2.7 percent
e. Sugar, confectionery, and desserts (ND) – -1.0 percent
f. Ready-made food and other food products n.e.c. (ND) – -2.5 percent
Moreover, the Milk, other dairy products, and eggs (ND) group maintained a steady inflation rate of 5.3 percent in June 2025.
C. PURCHASING POWER OF PESO
The Purchasing Power of Peso (PPP) is inversely related to inflation rate. Thus, as the inflation rate decreases, PPP inclines, as shown in Figure 2. In BARMM, PPP is at PhP 0.78 as of June 2025.
TECHNICAL NOTES:
Consumer Price Index (CPI)
The CPI is an indicator of the changes in the average retail prices of a fixed basket of goods and services commonly purchased by households relative to a base year.
Uses of CPI
The CPI is most widely used in the calculation of the inflation rate and purchasing power of peso. It is a major statistical series used for economic analysis and as a monitoring indicator of government economic policy.
Computation of CPI
The computation of the CPI involves consideration of the following important points:
a. Base Period
The reference date or base period is the benchmark or reference date or period at which the index is taken as equal to 100.
b. Market Basket
A sample of the thousands of varieties of goods purchased for consumption and services availed by the households in the country selected to represent the composite price behavior of all goods and services purchased by consumers.
c. Weighting System
The weighting pattern uses the expenditures on various consumer items purchased by households as a proportion to total expenditure.
d. Formula
The formula used in computing the CPI is the weighted arithmetic mean of price relatives, the Laspeyre’s formula with a fixed base year period (2018) weight.
e. Geographic Coverage
CPI values are computed at the national, regional, and provincial levels, and for selected cities.
Inflation Rate
the rate of change of the CPI expressed in percent. Inflation is interpreted in terms of the declining purchasing power of the peso.
Headline Inflation
refers to the rate of change in the CPI, a measure of the average standard “basket” of goods and services consumed by a typical family.
Purchasing Power of Peso
shows how much the peso in the base period is worth in the current period. It is computed as the reciprocal of the CPI for the period under review multiplied by 100.
Note: The dataset used in the special release is exclusive for BARMM provinces including Cotabato City and excluding Special Geographic Area (SGA).
Approved for Release:
SGD
ENGR. AKAN G TULA
OIC-Regional Director
EDFE/BMB/SGU
